We are honored to invite you to participate in the FLUXNET-ECN Spring Workshop 2021, which will occur on the days 15 and 16 of April 2021. The Workshop promotes the Year of Water Flux with a Webinar on the first day (9 am to 12 pm PT) and a Python Course (8 am to 12 pm PT) on the second day. The workshop is open to researchers of all career stages with a focus on early career researchers.
Register for this workshop:
https://lbnl.zoom.us/meeting/register/tJ0pdempqDsiHdOOQQmLx8XEi3GSYYkrZATJ
N.B.(1): We will be using a Zoom meeting format for this workshop, so registration will be needed to get the link to join.
N.B.(2): To use the same Zoom link in the two days of the Workshop, we needed to have a twin hourly schedule (9:00 am PT). But the Python course will start an hour earlier at (8:00 am PT).
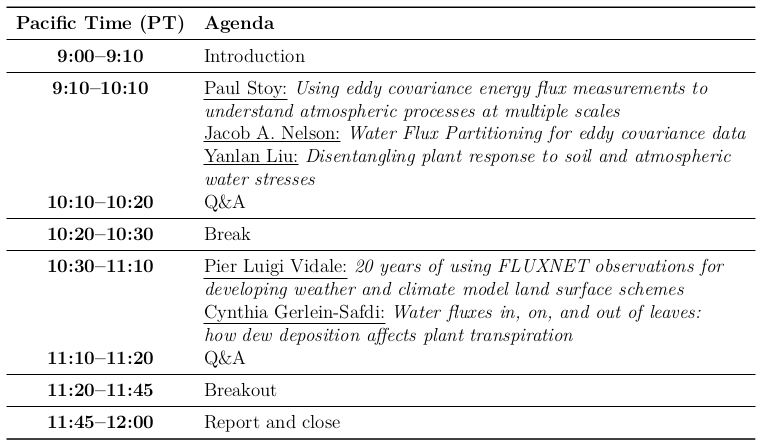
Webinar
The webinar on April 15th will host five renowned researchers’ to discuss the intersections and opportunities of flux measurements, modeling, and remote sensing. The lectures are free researcher themes of 20 min, followed by questions from the audience and discussions. The speakers’ are Cynthia Gerlein-Safdi, Jacob A. Nelson, Paul Stoy, Pier Luigi Vidale, and Yanlan Liu.
Python Course
The Python course on April 16th will follow the Year of Water Flux theme, exploring water flux variables. We ask all interested audiences to fill out the questionnaire (PyForm) to tailor the participant’s needs. Three environmental engineers of the Graduate Program in Environmental Engineering (PPGEA) at the Federal University of Paraná (UFPR) in Brazil, researchers at the Laboratory for Studies in Environmental Monitoring and Modeling (LEMMA), will give the course. They are André Luís Diniz dos Santos, Lucas Emilio B. Hoeltgebaum and Rafael Bueno.
We will explore the latest Python tools and techniques to help you tackle the world of data acquisition and analysis. You’ll review scientific computing with NumPy and Pandas, and visualization with Matplotlib. Users of any operating system are welcome and only need to have installed Python, NumPy, Pandas, and Matplotlib on machines. Will be sent in advance a tutorial with complete procedures for the installations in Linux, Windows, and Mac. We will send a simple script to run and test the installations in advance. Installations and test script running support or any questions regarding the course can be carried out by email previously.
Firstly it will be demonstrated how to register in FLUXNET and download some data sets to be used in the course. Then we will talk a little about FLUXNET2015 Dataset and its reference paper, introduce CC-BY-4.0 and TIER TWO licenses, data products (FULLSET, SUBSET, AUXMETEO, AUXNEE, ERAI, and PATCH1), temporal aggregation resolutions, data files naming convention, timestamps, time zone convention, column order, and missing data.
The Python part of the course will start with a brief introduction to python data type and NumPy. Python has several variable types that allow working with different data types, such as floats, integers, characters, dates, and others. The NumPy package is the best way to work with numeric data efficiently, and its union with pandas makes all the work even better. It will be demonstrated how to deal with them and how to transform one into another.
Dataframe is the primary entity of pandas, where all magic happens. It is a collection of several Series and is organized by index, which permits comparison between them. You will never more need to count in which column your Series is. The name of the label is enough. We will see how to set the columns we want to work on and what to do with them. The reading process in pandas is extremely easy, and we will learn how to turn the whole data Series into a Dataframe. We will set the index column and understand how the date-time type index can be easily interpreted by pandas, regardless of the format.
Then we will define the NaN data and learn how to work with them. The missing data (NaN) always occurs in practically all data series. It will be dealt with and teach some filling strategies, which could be annoying in other languages, but using Pandas, can be easy and fast. From basic to more complex operations can be done with Pandas, and most of them use just a
simple function or a few code lines. Finally, we will instruct on how to write our valuable work into output files in a wide variety of formats.
The Matplotlib module covers the basics of creating visualizations from Python. It will be introduced some general data visualization concepts and explained why the Matplotlib library is a good choice. Plots and scatters are two powerful graphs commonly used to investigate the relationship between two or more variables. Will be showed how to create plots and add many elements that a figure can be composed of.
The Matplotlib subplots function provides a way to plot multiple plots on a single figure. We will show how to plot multiple graphs within one figure. Histograms and boxplots are commonly used to demonstrate how many of a particular variable occurs within a specific range. It will be shown how we can generate these types of plots, including some statistics calculated with pandas.
Contour maps are an effective way of depicting a three-dimensional dependence using two-dimensional flat lines. We will show here how to plot a three-dimensional graph. Animated graphs can attract interest and assist understanding. Are also a powerful way to demonstrate ideas, concepts, theories, and methods in statistics. We will show how to make a live animation in Matplotlib.
Course Program
1 Introduction
1.1 Register on FLUXNET and download data
1.2 FLUXNET Data
2 Python, NumPy, and Pandas
2.1 Brief introduction to python data type and NumPy
2.2 Dataframes and Series
2.3 Data reading and index formats (numerical and timestamps)
2.4 Working with missing data and boolean indexing
2.5 Basic operations, grouping, resampling, merge, etc..
2.6 Output data
3 Matplotlib
3.1 General concepts
3.2 Plot and scatter
3.3 Subplots
3.4 Histogram and boxplot
3.5 Contour
3.6 Animation
Why should we use python pandas and whats is the advantage to use this tool with FluxNet data?
Lucas — For this kind of work, data processing and collection and sensors programming are important tasks that require the use of computation, and one of the most used languages for this purpose is Python, in addition to the Pandas package. Domain a programming language is important, because the amount of data available nowadays is huge, and doing it manually or using a spreadsheet could be impracticable. Python is an open-source and free language, extremely accessible, easy to learn, and without complications inherent to other languages, such as declarations of variables, and Pandas is one of their multiple packages that make the scientific work easier. The work becomes more productive, especially for reading/writing data, processing, and calculations involving date and time, which in general demands the programming of other functions inside the code. But, with pandas, the most needed processing tools are directly available, and in this course, we will learn some of them.
Why should we use python Matplotlib and what’s the importance of a good graphic visualization?
Rafael — Choosing an appropriate data visualization technique can help to explain a huge amount of complex data much more easily. Matplotlib is a plotting library for Python that produces publication-quality figures, animations, and interactive visualizations. Even though there are plenty of libraries in the market for data visualization that can do a really good job, Matplotlib gives us a nice level of access. We may pass data directly to the plotting tool without going through some intermediate software. Matplotlib can be used in web application servers and embed into applications using graphical user interface toolkits (such as Tkinter), which allows interactive visualization data for users.