FLUXNET is an international “network of networks,” tying together regional networks of earth system scientists. FLUXNET scientists use the eddy covariance technique to measure the cycling of carbon, water, and energy between the biosphere and atmosphere. Scientists use these data to better understand ecosystem functioning, trace gas dynamics, and air pollution.
Eddy covariance is the standard method that ecosystem scientists use to measure trace gas fluxes between ecosystems and atmosphere. A key benefit of the eddy covariance method is its ability to measure fluxes directly (in situ), without disturbing the ecosystem. Gas exchanges of carbon dioxide, methane, water, and more are measured at each individual site. Some eddy covariance sites have been collecting data for several decades, providing opportunities to study how ecosystems are changing over time.
Researchers working within regional networks process and analyze eddy covariance data, and then offer their data through regional network data portals. FLUXNET links these regional networks together, collecting their datasets to create processed and harmonized eddy covariance data products.
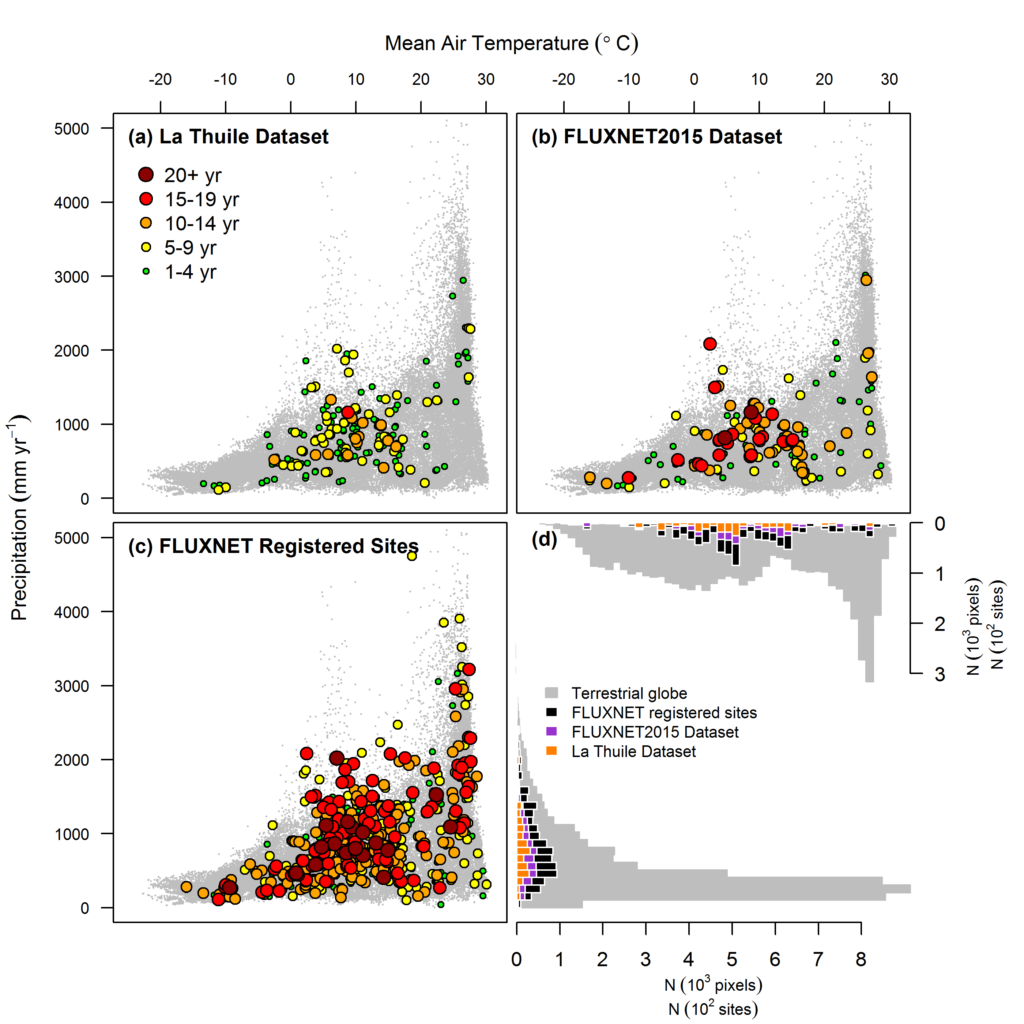
The most recent FLUXNET data product, FLUXNET2015, is hosted by the Lawrence Berkeley National Laboratory (USA) and is publicly available for download. Currently there are over 1000 active and historic flux measurement sites, dispersed across most climate spaces and representative biomes (Figure 1).
The FLUXNET website offers documentation and support to FLUXNET data users, and tools that enable idea sharing and engaging with the FLUXNET community. FLUXNET is one of the largest ecosystem networks in the world. The high level of collaboration among FLUXNET scientists ensures the robustness of data, and optimizes the usefulness of this resource.

Figure 1. Distribution of FLUXNET sites across temperature and precipitation ranges (a.k.a., Whittaker’s biome classification), compared to land surface from the terrestrial globe. The length of the record of sites is represented in the circle sizes and colors (a-c). Panel (a) shows the sites included in the La Thuile 2007 Dataset; panel (b) shows the sites included in the FLUXNET2015 Dataset; panel (c) shows all sites present in FLUXNET; and, panel (d) compares the distribution of land surface, FLUXNET sites, and sites in the FLUXNET2015 Dataset across these temperature-precipitation ranges. (Pastorello et al., 2017, EOS)
For more information on current and past FLUXNET datasets please see https://fluxnet.org/data/.
